Annual capital growth reflects the increase of a property investment over time. It is often used as a measure to compare the historic growth rate of different suburbs over a period of time. It is generally more robust to analyse the capital growth of a particular suburb over a longer period of time (e.g. 30 years) rather than a shorter period which may not reflect the impact of various economic cycles.
Working out the annual capital growth of a particular suburb requires 3 main pieces of data, as follows.
i = Value of Property in Year 1 ($)
c = Capital Growth Rate (%)
p = Investment Period (years)
The formula to work out capital growth is:
c = i x (1+ c)^p
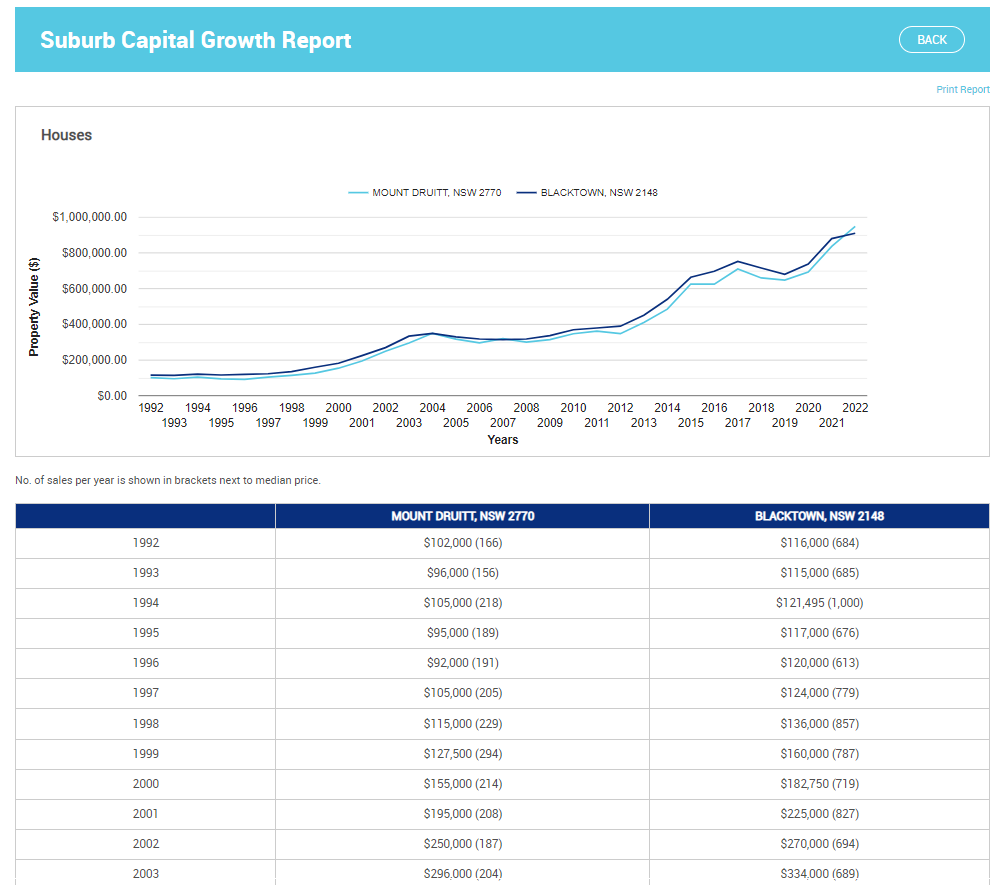
Lets use an example to illustrate this - lets say Jimmy is looking to invest in a property in Western Sydney, and he has narrowed down his preferred suburbs to Mount Druitt and Blacktown. He runs PropertyDirector's Suburb Capital Growth report over a period of 30 years to compare the annual capital growth for both suburbs.
See below a screenshot of the suburb capital growth report comparing the growth of both suburbs over a 30-year period.
Lets work out the annual capital growth for each of these suburbs, starting with Mount Druitt.
MOUNT DRUITT
The value of the property in Year 1 (1992) was $102,000.
The investment period is 30 years.
c = $102,000 x (1+c)^30
c = 0.0772
Therefore, the annual capital growth for Mount Druitt over the 30-year period is 7.72%.
BLACKTOWN
The value of the property in Year 1 (1992) was $116,000.
The investment period is 30 years.
c = $116,000 x (1+c)^30
c = 0.0711
Therefore, the annual capital growth for Blacktown over the 30-year period is 7.11%.
According to this, the annual capital growth for Mount Druitt was marginally better compared to Blacktown over a 30-year period.

